Where are all the ants? World-first ‘treasure map’ reveals hotspots for rare species
Simon KA Robson, CQUniversity Australia
The American biologist E.O. Wilson famously called invertebrates “the little things that run the world”. Despite their great importance, we still know very little about the worms, insects and other small creatures that make up the majority of animal species.
Working with researchers from around the world, we have made an important step to improve this knowledge: a high-resolution map of ant species across the globe.
Published today in Science Advances, this world-first map of ant diversity also acts as a “treasure map”, highlighting likely regions rich in undiscovered species.
A big part of our world
Invertebrates constitute the majority of animal species and are critical for ecosystem functioning and services. Nonetheless, global invertebrate biodiversity patterns and how they relate to vertebrate biodiversity remain largely unknown.
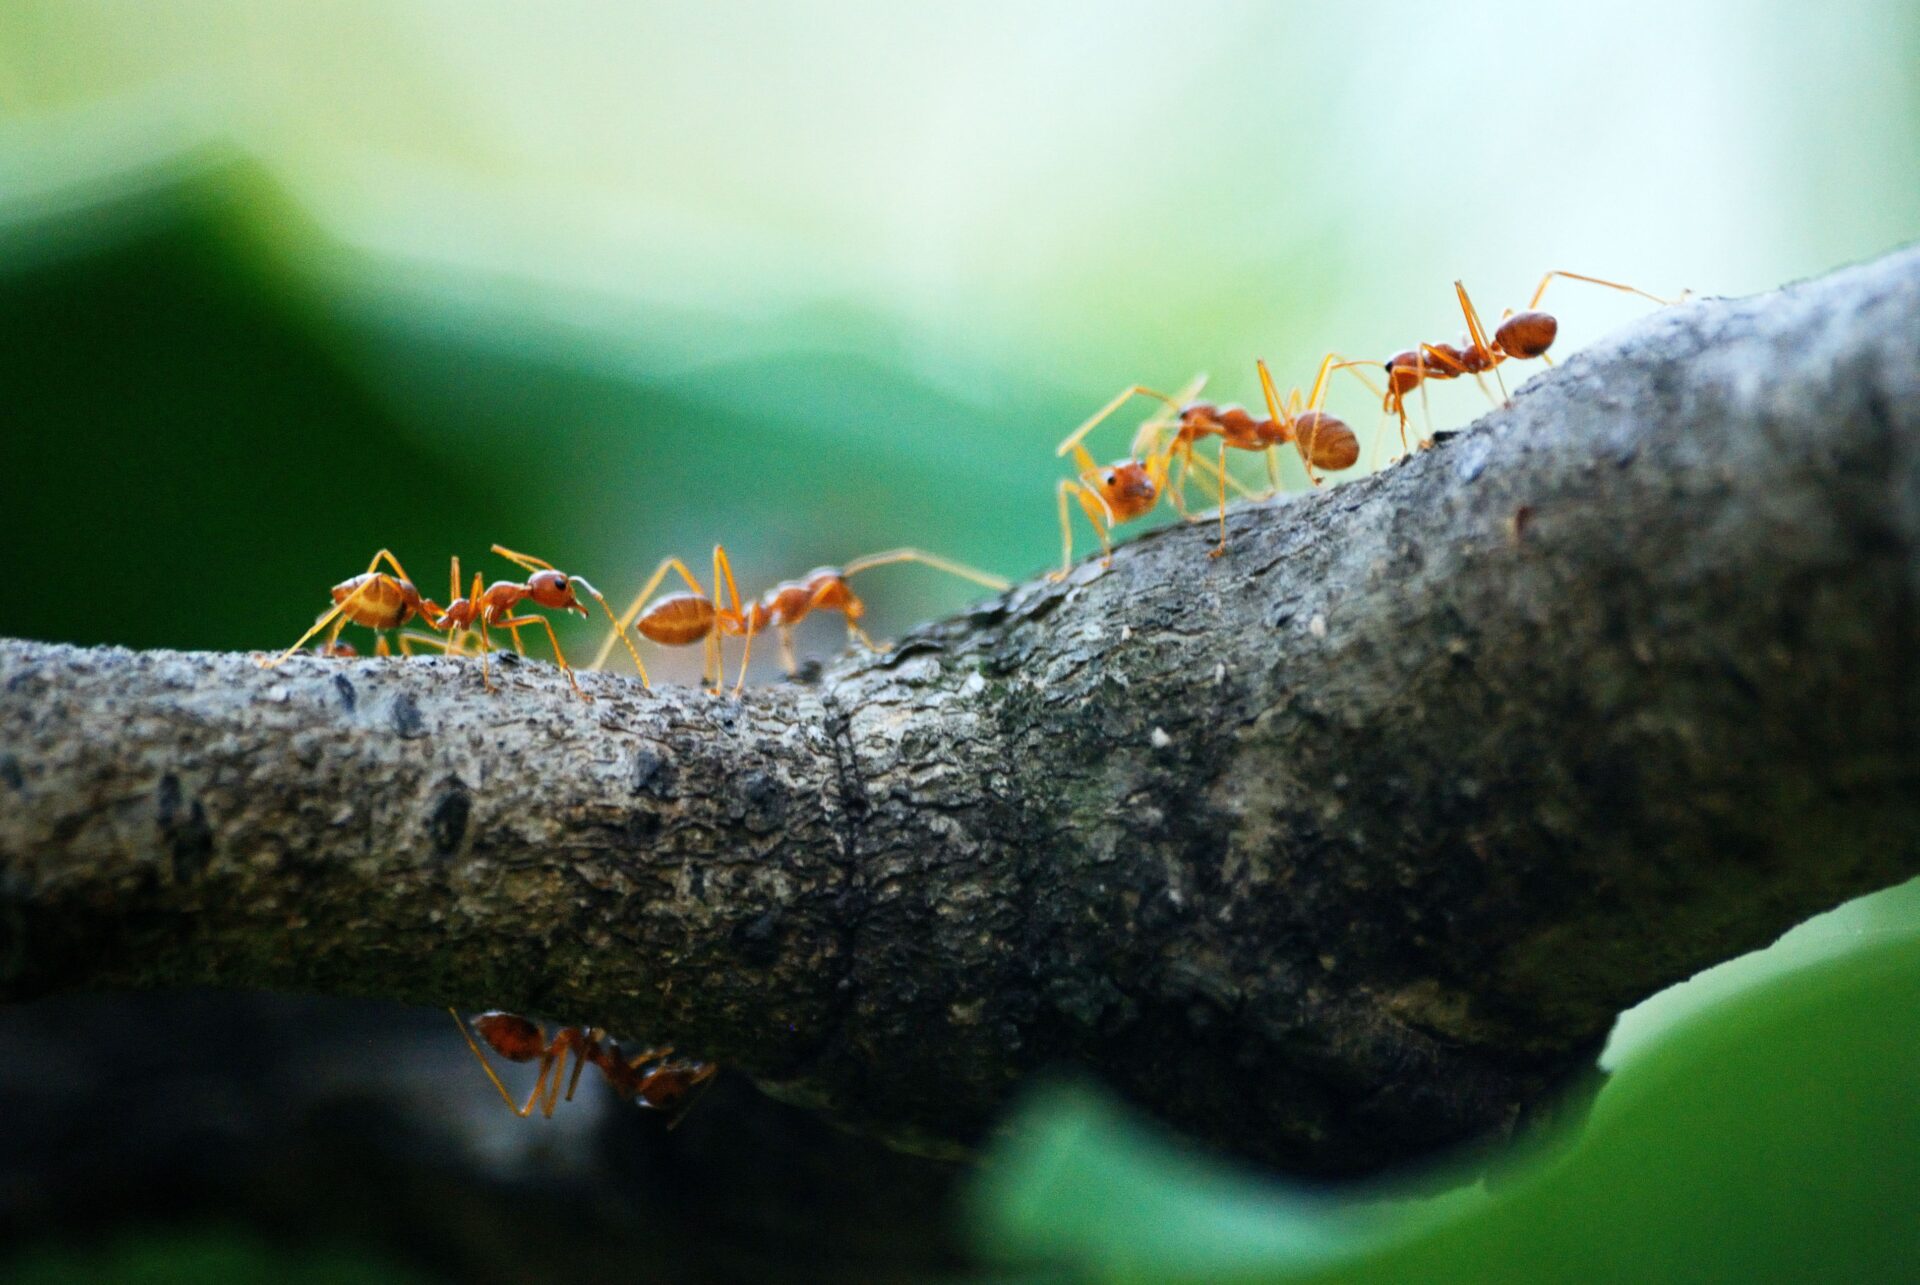
Like other invertebrates, ants are important for the functioning of ecosystems. They aerate soil, disperse seeds and nutrients, scavenge, and prey on other species.
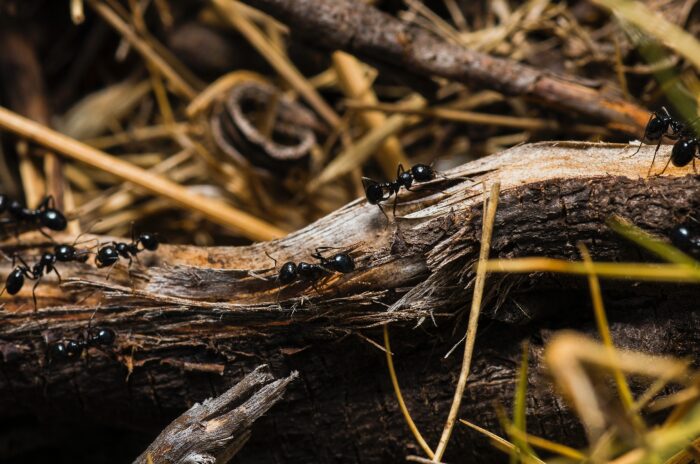
Ants are hunters, farmers, harvesters, gliders, herders, weavers and carpenters. They are a big part of our world: there are more than 14,000 known species of ants, and they comprise a significant fraction of the animal biomass in most terrestrial ecosystems.
They are globally widespread and abundant, and their known species’ richness is comparable to birds and mammals combined. Yet we still lack a global view of their biodiversity.
World-first high-resolution global diversity map of ants
We used existing knowledge about biodiversity along with range modelling and machine learning to create a high-resolution (~20 km) map of the global diversity of ants and predict where undiscovered diversity is likely to exist.
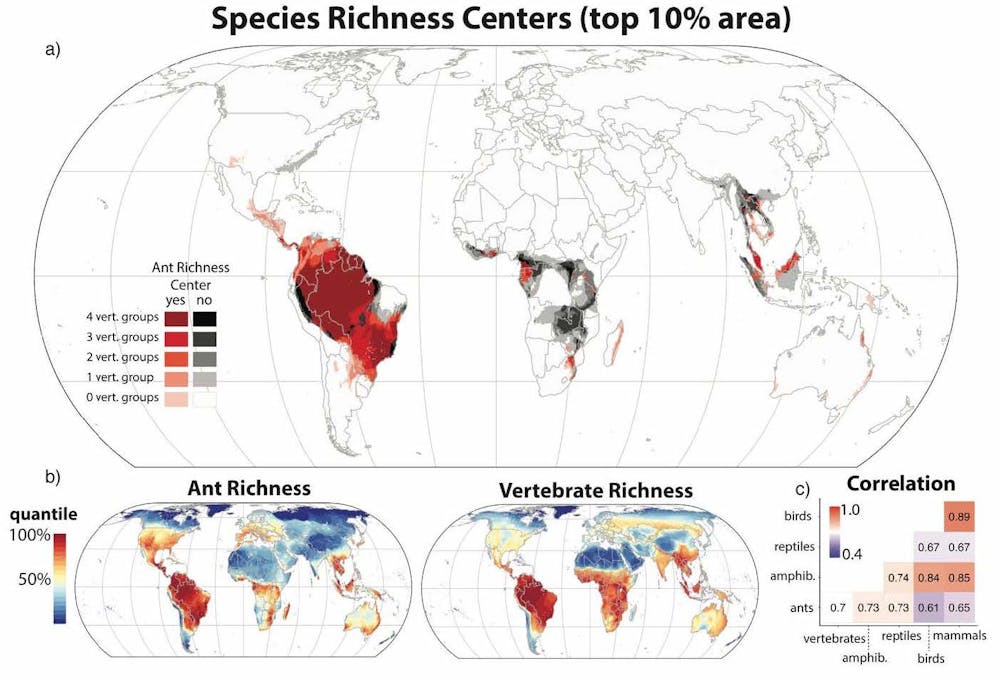
Kass et al., Sci Adv (2021), Author provided
Biodiversity among ants and other invertebrates is still poorly understood. We do not have good answers to basic questions such as which areas have the most species, which areas harbour concentrations of highly localised species, and even whether a major global decline in insect biomass is under way.
Through our research we found that, while the richness and rarity patterns of ants and vertebrate groups can show congruence, each has distinct features. This finding underscores the need to consider a diversity of taxa in conservation.
The research
This project began a decade ago with Benoit Guénard (then at the Okinawa Institute of Science and Technology, now at the University of Hong Kong) and Evan Economo (currently at Harvard). They set out to create a database of occurrence records for different ant species from online repositories, museum collections and around 10,000 scientific publications.
Researchers around the world contributed and helped identify errors. More than 14,000 species were considered.
However, the vast majority of these records, while containing a description of the sampled location, did not have the precise co-ordinates needed for mapping. To address this, Kenneth Dudley from the Environmental Informatics Section at the Okinawa Institute of Science and Technology created a way to estimate the co-ordinates from the available data and also check the data for errors.

Kass et al., Sci Adv (2021), Author provided
Then Jamie Kass and research technician Fumika Azuma, also at at the Okinawa Institute of Science and Technology, made different range estimates for each species of ant depending on how much data was available.
For species with less data, they constructed shapes surrounding the data points. For species with more data, the researchers predicted the distribution of each species using statistical models.
The researchers brought these estimates together to form a global map, divided into a grid of 20km by 20km squares. It shows an estimate of the number of ant species living in each square (called the species richness).
They also created a map showing the number of ant species with very small ranges in each square (called the species rarity). In general, species with small ranges are particularly vulnerable to environmental changes.
Unsampled territory
However, there was another problem to overcome: sampling bias.
Some parts of the world that we expected to have high levels of diversity were not showing up on our map, but ants in these regions were not well studied.
Other areas were extremely well sampled, for example, parts of the USA and Europe. This difference in sampling can impact our estimates of global diversity.
So, we used machine learning to predict how the diversity would change if we sampled all areas around the world equally. In this process, we identified areas where we think many unknown, unsampled species exist.
This gives us a kind of “treasure map”, which can guide us to where we should explore next and look for new species with restricted ranges. Within Australia, high levels of ant biodiversity are found along the east, north-western and south-western coasts.
Finally, we looked at how well-protected these areas of high ant diversity are.
We found it was a low percentage – only 15% of the top 10% of ant rarity centres had some sort of legal protection, such as a national park or reserve, which is less than existing protection for vertebrates.
Clearly, we have a lot of work to do to protect these critical areas.![]()
Simon KA Robson, Professor, CQUniversity Australia
This article is republished from The Conversation under a Creative Commons license. Read the original article.